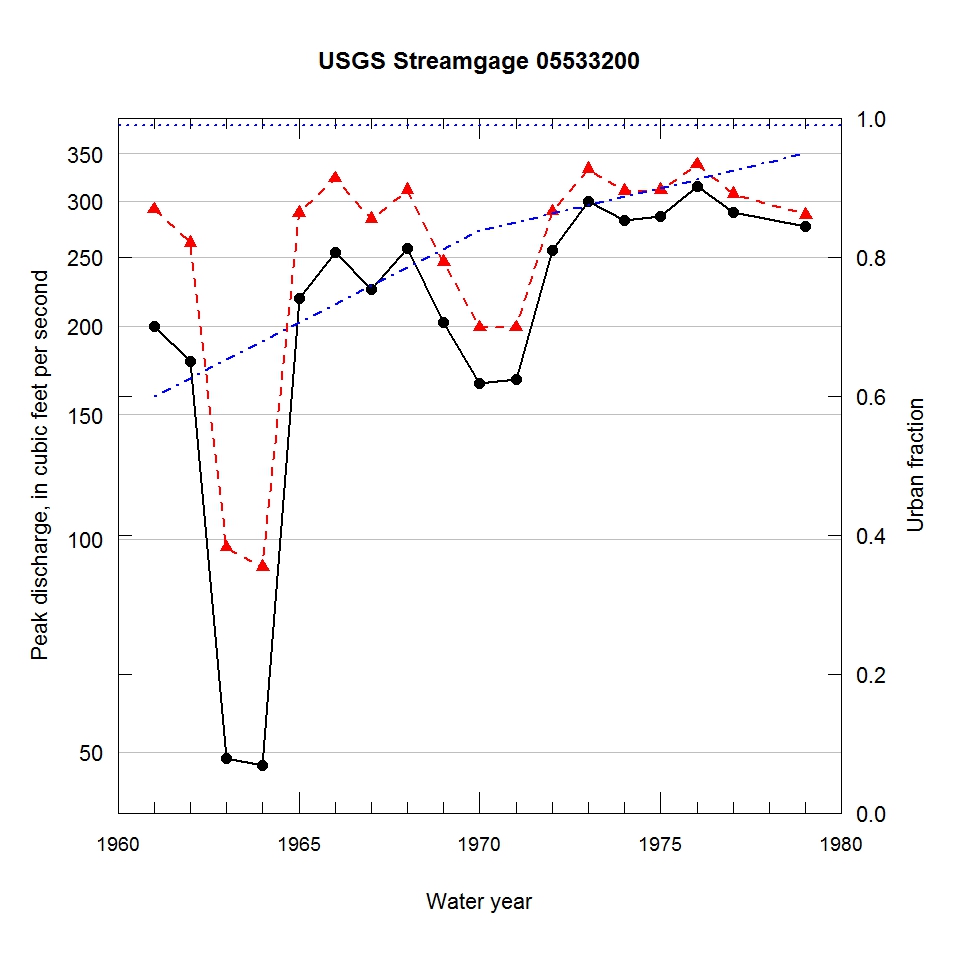
Observed and urbanization-adjusted annual maximum peak discharge and associated urban fraction and precipitation values at USGS streamgage:
05533200 SAWMILL CREEK TRIBUTARY NEAR TIEDTVILLE, IL


| Water year | Segment | Discharge code | Cumulative reservoir storage (acre-feet) | Urban fraction | Precipitation (inches) | Observed peak discharge (ft3/s) | Adjusted peak discharge (ft3/s) | Exceedance probability |
| 1961 | 1 | -- | 0 | 0.600 | 2.199 | 200 | 292 | 0.263 |
| 1962 | 1 | -- | 0 | 0.626 | 0.420 | 178 | 262 | 0.389 |
| 1963 | 1 | -- | 0 | 0.653 | 1.400 | 49 | 97 | 0.981 |
| 1964 | 1 | 4B | 0 | 0.679 | 0.420 | 48 | 91 | 0.984 |
| 1965 | 1 | -- | 0 | 0.706 | 0.980 | 219 | 289 | 0.272 |
| 1966 | 1 | -- | 0 | 0.732 | 4.049 | 254 | 323 | 0.191 |
| 1967 | 1 | -- | 0 | 0.759 | 1.180 | 225 | 283 | 0.293 |
| 1968 | 1 | -- | 0 | 0.785 | 3.069 | 257 | 311 | 0.213 |
| 1969 | 1 | -- | 0 | 0.812 | 1.739 | 202 | 246 | 0.460 |
| 1970 | 1 | -- | 0 | 0.838 | 1.230 | 166 | 199 | 0.673 |
| 1971 | 1 | -- | 0 | 0.850 | 0.560 | 168 | 199 | 0.676 |
| 1972 | 1 | -- | 0 | 0.863 | 1.450 | 256 | 290 | 0.269 |
| 1973 | 1 | -- | 0 | 0.875 | 0.600 | 300 | 333 | 0.176 |
| 1974 | 1 | -- | 0 | 0.887 | 1.609 | 282 | 310 | 0.216 |
| 1975 | 1 | -- | 0 | 0.899 | 2.299 | 286 | 311 | 0.214 |
| 1976 | 1 | -- | 0 | 0.912 | 0.960 | 315 | 338 | 0.169 |
| 1977 | 1 | -- | 0 | 0.924 | 1.360 | 289 | 307 | 0.223 |
| 1979 | 1 | -- | 0 | 0.948 | 1.140 | 276 | 287 | 0.277 |

